Thursday, May 15, 2008

Nice tool to analyze Subprime data


I just found out that the FED released a tool 2 months ago to analyze subprime and Alt-A mortgages at county, state and zipcode level. It looked cool. So, for those who plan to purchase a house or for those who are curious to know how different regions of the country are faring in Subprime, this would be interesting.

http://www.newyorkfed.org/mortgagemaps/

clip_image002

Why are CA and FL hit mainly by mortgage crisis? Striking difference between Jumbo and non-jumbo mortgages

I was going through ofheo’s data (Office of Federal Housing Enterprise) and one thing that mainly struck me was the dramatic difference between the Jumbo and Non-jumbo mortgages. In the first chart, the left bar is the Jumbo and the right bar is the non-jumbo. See how traditional was the non-jumbo market with mostly FRMs (Fixed Rate Mortgages). But, we see all sort of exotic things in Jumbo mortgages. We know from anecdotal evidence that this must be true because jumbo loans are unaffordable for a lot of people and GSE’s cannot take and so people try all sort of funny stuff, but now with hard data it is so clear why the mortgage crisis happened. And the second chart on the right, show the all the usual suspects on the top – with CA alone accounting for one-half of all jumbo loans issued in the country.

The scale of exotic stuff in the first chart (about 75% of total jumbo) really surprised me. And in the third chart at the bottom we can see how conforming loan limits have dramatically increased even faster than home appreciation rates in the last 20 years, even without the current government proposal.

clip_image001 clip_image002

Source:

http://www.ofheo.gov/media/research/MMNOTE11108.pdf

clip_image003

Source: http://www.ofheo.gov/media/mmnotes/MMNOTE072.pdf

OPEC's gimmicks


We all know oil prices have been going up to extraordinary levels. Let us see some patterns in it. Look at what OPEC did to oil. When prices was skyrocketing they cut production sharply and when it started falling, they increased it substantially. So, the thing for oil investors to watchout is not just China and India’s demand increase, but what goes in the minds of the OPEC.

clip_image001[5]

clip_image001

Dollar at INR 42.6 ...................................... Going up, up, up

There are conflicting reports emerging from various investment banks on Indian rupee (that already went to 42+) but it looks like most are forecasting a weaker rupee. Given that a lot of analysts would say “dark clouds are gathering” for a rain that has started J, I take analyst reports with a pinch of salt, but still the underlying fundamentals mean that rupee will weaken this year. Slowest industrial growth in over 7 years, historic oil prices and an American recession seems to have already taken a toll on India. Goldman Sachs and UBS have already given a lower forecast for rupee, while Lehman Brothers feel that Indian government might strengthen it to reduce inflation. The only way to do it is increasing interest rates, and I don’t think the government could do it in the face of weaker growth. On the other hand, just like when rupee went stronger, it is not just the rupee but it was the dollar that was going down. Now, it is reverse. The last 10 days dollar is getting a lot of strength.

http://in.reuters.com/article/domesticNews/idINBOM4212620080507

http://www.bloomberg.com/apps/news?pid=20601091&sid=a.dHO1ACVGtQ&refer=india

http://www.bloomberg.com/apps/news?pid=20601091&sid=a6C7NuEzjwO8&refer=india

For those who want to send money to India, this is good (not for me L).

clip_image001

Will oil prices go down or up?

One of my colleagues gave the following 10 reasons of why oil price would go down soon..

1. Everybody thinks it will go higher

2. Speculation has caused the price to climb and will make it crash once it starts to go down.

3. Higher gas prices will start to make an impact on petrol consumption

4. The dollar will plateau or slightly recover

5. Avg mpg of cars worldwide continues to go up

6. We had a wet winter with a lot of snow in the west which will mean more  hydro power is available; especially compared to the last few dry years.

7. US oil reserves are full

8. China will consume less oil during the month of august to control air pollution

9. Airline consolidation is causing fewer flights (and they are also flying slower to save 1-2% of kerosene)

10. People will see the end of the war in Iraq coming and the corresponding in reduction in consumption of military oil

Here are 7 reasons why it might not go down according to me:

US defense while being one of the biggest consumers of oil in the world, still accounts for less than 400,000bbl/day while US total consumption is well over 50 times that. So, even if you think the Iraq war will be over (I don’t think that Iraq war is anywhere near to the end) and even if the entire US military establishment is closed from tomorrow, US consumption would go down barely by 2% and it would hardly be blip in the world consumption of about 82million bbl/day.

Airline consolidation is a long drawn out thing and the government will not be folding its hands to see all the airlines cutting all the smaller cities. Even if all airlines consolidate and the entire government establishment is happy with, the increase in driving necessary to substitute the air travel could more than substitute the reduction in consumption.

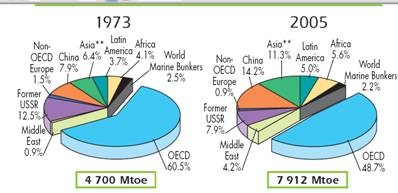
China might more likely increase the consumption rather than decrease consumption of oil to curtail pollution. This is because they use the problem is in their dirty coal, and to reduce pollution they might be hard pressed to substitute some of the coal sources with less polluting oil sources.

US strategic reserve is a bit big (worth of slightly more than a month’s supply of oil – at 700 million bbl) but US has never drawn from it in 3 decades, except for some 17 m bbl in 1991 Gulf war and a similar amount during Katrina. Unless there is a major disaster next year there is very little chance that US will draw from strategic reserve. That said, if it is full, in a way it would help to slightly reduce the oil prices because the US government would stop further purchases of oil to fill it. This effect is only be marginal.

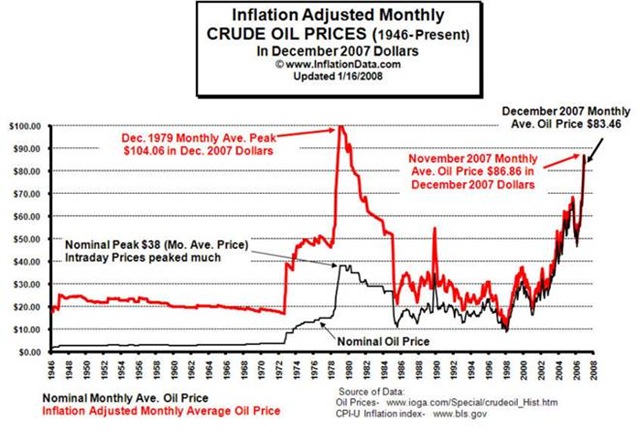
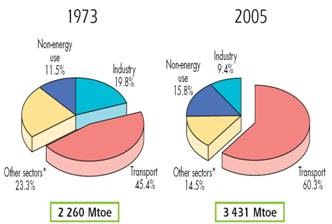
Higher oil prices will impact on consumption or cars becoming fuel efficient is only in the long term. It would be unrealistic for a Humvee or a Ford Pickup driver to immediately switch to Smart or Civic or Prius or any such ilk. In fact, the price at the pump is well past $3 since 2006, and the consumption has barely slowed down at 0.3 % ending this April. This slowdown was more than made up by increase in consumption in Saudi Arabia and elsewhere.

Dollar recovery will only be marginal. The credit crunch is far from over. The problems that have surfaced since last August have not gone away and if anything house prices are only heading south every month.

So, in the end there are some minor cases for oil consumption to go down, but $50 or $80 is a bit of a stretch.

Is India in the ring of fire?

clip_image002

I was just plotting the biggest natural disasters of this decade in the order of number of deaths and a big pattern starts to emerge – it looks like India is in the center of everything. And 3 of these events (Tsunami, Myanmar Cyclone and Kashmir Earthquake) would go into the world’s all-time records in death – An ugly record. And it is not the traditional floods and famines of earlier centuries that took the big lives. The new events - Tsunami, Earthquakes and a lot of factors seem to be pretty new to the subcontinent. I didn’t plot many other relatively smaller events like the historic rainfalls in Mumbai and Bangalore and Chennai that occurred in the middle of this decade and if we started plotting them soon we will fill up the entire space. Maybe all these events are just a coincidence – but as a nation how prepared are we to tackle such big challenges particularly in the wake of what climatic changes and geological plate movements can bring to us.

Gujarat 2001 is in my plot and 1993 is recent in the geological terms J. Deccan plateau historically is one of the stablest regions and I learnt somewhere that it was one of the safest region in terms of Earthquakes (I don’t have any links to backup this hypothesis). So, in our ancient history we didn’t have that much mention of earthquakes. But, the plate below the Deccan (whose pushing into Asian plate gave rise to the Himalayas and also altered the course of three pre-Himalayan rivers from Manasarovar region -  Indus, Brahmaputra and Sutlej) is currently unstable as Himalayas have reached the certain level and it cannot tolerate the Deccan pushing it any more J. So, this plate movement is leading to a lot of things along the fault lines and the Indian ocean Tsunami, Kashmir Earthquake and the quakes in the boundary of Deccan (Bhuj and Lattur). So, we are in for far more disastrous earthquakes. And the climatic changes (due to Global warming or otherwise) could screw up the monsoons big deal. It might be interesting to point out the Sahara desert was not a desert a few thousand years ago, before the monsoon that was bringing it rain changed course. So, if our monsoon changes course there might be different cyclonic patterns and things like Burmese Cyclone or historic rainfalls in rest of India have to be prepared for.

You can start looking from here:

http://en.wikipedia.org/wiki/India_Plate

http://www.scotese.com/indianim.htm

Interesting stats on how Oil consumption patterns changed

I was collecting some data from International energy agency and here are some interesting results of how the world energy usage has changed since the first oil shock.

You can see the original data for this report at: http://www.iea.org/Textbase/nppdf/free/2007/key_stats_2007.pdf

How energy consumption changed – energy consumption by region... OECD's consumption as a percentage of world enegy has come down significantly

clip_image001

Since 1973 shock, Oil’s share in energy use has substantially come down from over 46% to just 35% now. Every other energy source increased.

clip_image002

Oil production stats – Middle east’s share of world oil has reduced significantly since 1973 from 37% to 31%.

clip_image003

How coal markets changed – China became leader while OECD and Soviet receded

clip_image004

Source of electricity - Oil is no longer used to generate electricity

clip_image005

Oil usage by sector - Transportation is gobbling up a lot of energy

clip_image007